
COVID Hammers the Economy
Economic impacts of the coronavirus pandemic begin to show up in the hard data for first quarter 2020

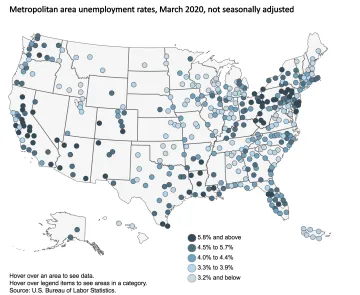
Current data releases as May 8, 2020 - Unemployment rates were higher in March than a year earlier for all Arizona metropolitan areas. This held true for 253 of the 389 metropolitan areas listed in the Metropolitan Area Employment and Unemployment release from the U.S. Bureau of Labor Statistics on April 29. Unemployment was unchanged in 13 areas, and lower in 123 areas. Yuma had the second-highest unemployment rate in the nation at 14.8 percent while El Centro, CA had the highest at 20.5 percent. The March 2020 unemployment rate for other Arizona metro areas: Flagstaff 7.1 percent, Lake Havasu City-Kingman 6.7 percent, Phoenix 4.7 percent, Prescott 5.1 percent, Sierra Vista 6.5 percent, and Tucson 5.2 percent. The unemployment rate is the number of unemployed people as a percentage of the labor force – see A Primer on Classifying U.S. Labor Force Characteristics for more information on who counts as part of the labor force. The April employment report for metropolitan areas is scheduled for release on June 3.
U.S. nonfarm payroll employment dropped by 20.5 million in April according to the Bureau of Labor Statistics May 8 release, which indicated changes in employment reflect effects of the COVID-19 pandemic. Employment fell in all major sectors, and was a dramatic drop for leisure and hospitality. The U.S. unemployment rate jumped 10.3 percentage points to 14.7 percent for April, the highest rate and the largest over-the-month change in the history of the series, which goes back to January 1948 for seasonally adjusted data. The employment-population ratio decreased to 51.3 in April compared to 60.0 in March and 61.1 in February. The employment-population ratio is the percent of the population currently working or the number of employed as a percentage of the civilian noninstitutional population. This is also the lowest employment-population ratio in the history of the series. For the working age population (25-54 years) the figure of 69.7 is the lowest since 1975. The number of persons working part time for economic reasons almost doubled between March and April.
The U.S. trade deficit increased to $44.4 billion in March, up $4.6 billion from February. Both exports and imports declined for the month, partially due to the impact of COVID-19 pandemic according to a joint U.S. Bureau of Economic Analysis/U.S. Census Bureau release on May 5. Exports decreased $20.0 billion to $187.7 billion in March while imports shrank by $15.4 billion to $232.2 billion. The goods and services deficit was down 17.8 percent year-to-date compared to the same period in 2019.
The U.S. Census Bureau released final annual estimates for 2019 building permits on May 1. Single-family building permits in Arizona increased 5.8 percent between 2018 and 2019, compared to a less than one percent increase nationally. Total permits increased 11.8 percent in Arizona and 4.3 percent in the U.S. Within Arizona, Tucson was the only metropolitan area to have fewer total permits for 2019 than 2018, with a decrease of 2.1 percent. Single-family permits increased, however, by 7.7 percent. The percent change in single-family permits for Arizona metropolitan areas in 2019: Flagstaff -18.6 percent, Lake Havasu City-Kingman 11.0 percent, Phoenix-Mesa-Chandler 6.4 percent, Prescott Valley-Prescott -6.4 percent, Sierra Vista-Douglas 17.5 percent, Tucson 7.7 percent, and Yuma 18.7 percent.
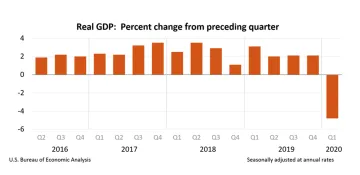
Real GDP declined at an annual rate of 4.8 percent for the first quarter 2020 based on an advanced estimate from the U.S. Bureau of Economic Analysis released on April 29. Real GDP had increased 2.1 percent in the fourth quarter 2019. Another estimate for the first quarter 2020 based on more complete data will release on May 28.
Home price increases in Phoenix continued to outpace the nation in February according to the April 28 S&P CoreLogic Case Shiller Indices. The year-over-year home price increase for Phoenix was 7.5 percent in February, the highest among all metropolitan areas tracked in the indices. This compared to 4.2 percent nationally. The 20-city composite increase was 3.5 percent. Both U.S. and 20-city composite price gains were higher than they had been the month previous. Over-the-year prices increased the least in Chicago for February at 0.7 percent.