
MAP Dashboard: Benchmarking K-12 Student Achievement
Tucson lags behind peer metros

Measuring K-12 student achievement is a complicated undertaking. A new article from the MAP Dashboard summarizes three commonly used measures, each with its own strengths and weaknesses.
AzM2 exams are administered every fall and spring in Arizona to test proficiency in English Language Arts and math for students in grades 3-8. Standardized aptitude tests allow schools to measure a student’s knowledge on a broad range of abilities and skills that are often thought of as important for future success in school. These data provide useful metrics, but have you ever wondered how students in Arizona compare to those in California or Colorado? Unfortunately, the AZM2 data cannot be used for that purpose.
Test scores are often compared across states using National Assessment of Educational Progress (NAEP) data. NAEP is an ongoing student assessment program conducted by the National Center for Educational Statistics under the U.S. Department of Education. NAEP assessment includes students from across the nation who are selected at random. These data allow for a state-to-state or state-to-nation comparison but not for a more nuanced comparison of school districts, cities, or metropolitan areas.
Another source of cross-state comparisons is the Stanford Education Data Archive (SEDA). These data allow for comparisons across metropolitan areas and are based on the standardized accountability tests in math and Reading Language Arts (RLA) administered by each state to all public-school students in 3-8th grade for the 2008-2009 through 2017-2018 school years. The SEDA data aligns state tests to the NAEP and finds the national average for each grade such that an average score for 3rd grade is a 3.0, 4th is 4.0, etc. The SECA data reports on three aspects of educational opportunity: average test score, learning rates, and trends in test scores.
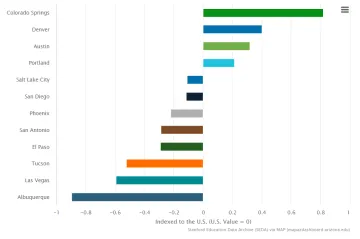
Overall, the SEDA data across all grades levels and subjects for all of the years of data available suggest that students in the Tucson Metropolitan Statistical Area (MSA) were approximately half a grade year behind the national average with a score of -0.5. A value of 0 represents the national average for all students, values less than 0 indicate scores below the national average, and values above 0 represent scores above the national average. For example, a -1 would be one-grade level behind and a +1 would be one-grade level ahead. Compared to peer MSAs, Tucson had the third-lowest average score. Albuquerque had the lowest at almost a full grade level behind (-0.9), and Colorado Springs had the highest at nearly a full grade level ahead (+0.8) as illustrated in Exhibit 1.
Exhibit 1: Average SEDA Test Scores for Grades 3-8 across All Subjects and Years of Data
Click here to view the full article on the MAP.
The Making Action Possible (“MAP”) Dashboard project was formed through a unique partnership between the university, non-profit, and business community to develop a project that will measurably improve Southern Arizona through data driven collective civic action and education. The project measures and monitors trends against a set of key performance indicators across six interest areas. The project mirrors over 125 similar projects across the country and is managed by a team representing the major sponsors of the project, The University of Arizona, the Community Foundation for Southern Arizona, the Pima Association of Governments, the Southern Arizona Leadership Council, and Sun Corridor Inc.