
Arizona’s Economy Sails Into Uncertain Waters
As cross currents buffet the Arizona economy, it looks different depending on the lens used to view it.

As cross currents buffet the Arizona economy, it looks different depending on the lens used to view it. The labor market remains very tight, generating strong job gains, low unemployment rates, rapid wage increases, and a mountain of open jobs. At the same time, retail sales has begun to slow, inflation far exceeds income growth, housing affordability has plunged, and interest rates are rising.
The baseline forecast for Arizona calls for slowing growth in 2022 and 2023, as fiscal policy contracts and monetary policy hits the brakes. While the baseline forecast calls for continued state and national growth in the near term, the pessimistic scenario, which includes a national recession, is almost as likely.
In the long run, Arizona is projected to far outpace national growth, with the Phoenix MSA leading the way. Tucson grows as well, but at a slower pace. Downside risks appear elevated in the long run as well, particularly as drought raises concerns about the long-term availability and cost of water.
Arizona Recent Developments
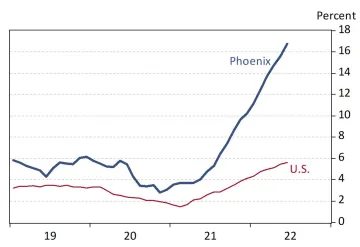
While U.S. and Phoenix MSA consumer price inflation has accelerated significantly since early 2021, Phoenix prices are now rising at a much faster pace than nationally. In June 2022, the Phoenix all-items CPIU rose by 12.3% over the year, compared to 9.1% nationally. The pace of inflation in commodities (gas, food, apparel, home furnishings, etc.) in Phoenix has been similar to the national rate, but services inflation (housing, medical care, recreation, etc.) has been much faster.
The main driving force for faster inflation in Phoenix, relative to the nation, is shelter. The shelter CPIU includes rent, owners-equivalent rent, shelter away from home (hotels, etc), and tenant and household insurance. In June the Phoenix shelter CPIU rose over the year at roughly triple the national rate (16.7% versus 5.6%, Exhibit 1).
Keep in mind that changes in the shelter CPIU tend to lag market prices because it takes time for existing leases to catch up to changes in market rates.
Exhibit 1: Phoenix Shelter Inflation Far Exceeds the National Pace, Phoenix and U.S. Shelter CPIU, Over-the-Year Growth, Percent)
Arizona added 22,900 jobs over the month in July, up from a revised 11,600 the prior month. The initial June estimate suggested the state added 15,000 jobs over the month. Growth in July was nearly quadruple the average monthly job gain during the five years before the pandemic began (6,300/month).
The state’s seasonally-adjusted unemployment rate was stable at 3.3%, just below the national rate of 3.5%.
Arizona jobs are now 87,000 higher than their pre-pandemic level. That growth was driven by trade, transportation and utilities, financial activities, manufacturing, education and health services, construction, professional and business services, and information. Jobs in other services and natural resources and mining were roughly back to pre-pandemic levels, while leisure and hospitality and government remained well below their February 2020 level.
While leisure and hospitality jobs remained below their February 2020 level for the state, the same is not true in Phoenix or Tucson. Leisure and hospitality jobs in Phoenix were 1,600 above their pre-pandemic level in July and jobs in Tucson were 1,000 jobs above their February 2020 level.
Job recovery rates remained uneven across Arizona’s metropolitan areas in July. There were three metropolitan areas that have yet to recover all of the jobs lost during the first two months of the pandemic. Through July, Sierra Vista-Douglas recovered 86.4% of the jobs lost during the February to April 2020 period, Flagstaff recovered 96.9%, and Tucson recovered 98.2%. In July, jobs in Tucson were just 800 below their pre-pandemic level. Tucson is on track to roughly follow the U.S. recovery timing (the U.S. reached 100% recovery in July, according to the preliminary data).
As inflation has accelerated, it has reduced the purchasing power of personal income. After adjustment for inflation Arizona’s personal income has been drifting down recently. Even so, in the first quarter of 2022 it was still above its pre-pandemic level (first quarter of 2020) by 2.8%. Net earnings from work was up by 4.3% and transfers were up 8.8%. Real income from dividends, interest, and rent was down 8.1% from its pre-pandemic level.
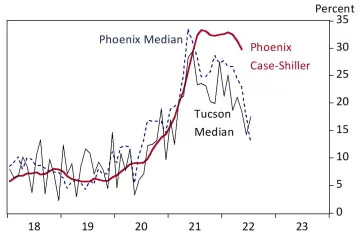
Arizona home price increases began to soften in June with the median price in Phoenix dropping by 2.0% over the month to $500,000 (nonseasonally adjusted) and then again in July to $485,000. The median home price in Tucson was flat in July at $370,000. Over the year, median sales prices in July were up 12.8% in Phoenix and 17.5% in Tucson (Exhibit 2). For Phoenix, that was the slowest growth since June 2020. The Phoenix MSA Case-Shiller index rose 29.7% over the year in May, the most recent month available. That was the slowest growth since June 2021.
Exhibit 2: Phoenix and Tucson Home Price Growth Softens, Over-the-Year Growth Rates, Percent
Housing affordability continued its downward plunge in the second quarter of 2022. Nationally, 42.8% of homes sold were affordable to a family making the median income, down from 56.9% in the first quarter and down from 63.2% in the fourth quarter of 2021.
The drop in housing affordability in Phoenix has been even more dramatic, with the second quarter 2022 reading at 22.3%. That was down from 43.9% in the first quarter and down from 64.9% in the last quarter of 2019. It was also the lowest reading since 2000. Even so, housing affordability in Phoenix was better in the second quarter than Los Angeles (3.6%), San Francisco (7.5%), and San Jose (11.1%).
Housing affordability was much better in Tucson in the second quarter of 2022, at 40.6%. Even so, it was down from 66.0% in the first quarter, down from 71.2% in the last quarter of 2019, and below the national average.
Arizona housing permit activity was strong through the first seven months of 2022, driven by multi-family activity. Total permits through July were up 9.0% from the same period last year. Single-family permits were down 3.5% while multi-family activity was up 45.6%.
Through July 2022, permits were up 10.0% over the year in Phoenix, with single-family permits down 3.3% and multi-family permits up 44.4%. In Tucson, total permits were up 11.9%, driven by a 117.2% increase in multi-family activity. Single-family permits were down 8.9%.
Arizona Short-Run Outlook
The outlook for Arizona, Phoenix, and Tucson depends in part on national and global economic events. The forecasts presented here are based on U.S. projections released by IHS Markit in July 2022. The baseline forecast (summarized here) is still assigned a 50% probability. The pessimistic scenario is now assigned 45% and the optimistic scenario is assigned the remaining 5%.
IHS Markit calls for real GDP growth in 2022 to hit 1.4%. Growth in 2023 is also slow at 1.3%. This reflects the end of pandemic-related fiscal support and continued tightening by the Federal Reserve.
The forecast calls for inflation to spike in 2022 to 7.8%. Inflation decelerates rapidly to 3.3% in 2023, as commodity and oil prices fall, supply-chain issues ease, and the unemployment rate rises.
Nonfarm payroll jobs nationally dropped by 5.8% in 2020 but rebounded in 2021 with growth of 2.8%. The forecast calls for jobs to rise by 3.9% in 2022 and 0.9% in 2023.
The unemployment rate peaked at 8.1% for the year in 2020 but fell to 5.4% in 2021. It is forecast to decline to 3.7% in 2022 before rebounding to 4.3% in 2023 and 4.9% in 2024 as output growth slows and immigration and labor force participation rise.
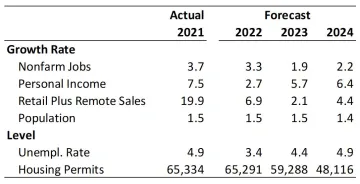
Continued growth in the U.S. economy, under baseline assumptions, sets the stage for continued growth in Arizona, Phoenix, and Tucson. As Exhibit 3 shows, the forecast calls for Arizona job growth to decelerate in 2022 and 2023, before a modestly accelerating in 2024. This pattern reflects a complicated mix of factors, including the shift to more normal gains as the pandemic eases and slowing national growth in 2023. The unemployment rate drifts up as job gains slow.
Personal income growth, before adjustment for inflation, slows significantly in 2022, reflecting the end of federal income support related to the pandemic. Growth in retail (plus remote) sales follows a similar pattern, but with a lag. Slowing sales of goods also reflects a renormalization of consumer spending, away from goods and toward travel and tourism related services.
Population gains remain solid in the near term but begin to slow in 2024 as demographic forces begin to take hold. Population gains, even in the short run, are driven primarily by net migration, as natural increase decelerates. Housing permits drop in the near term to a level more consistent with population gains.
Exhibit 3: Arizona Short-Run Outlook
Arizona Long-Run Outlook
The long-run forecast calls for Arizona to continue to outpace national growth, although those gains are expected to come at a much slower pace than during the prior 30-year period. Arizona is projected to add 1.4 million jobs from 2022 to 2052, which translates into an annual growth rate of 1.3% per year. That is faster than the national pace of 0.4% per year but much slower than the average annual growth rate of 2.3% per year during the prior 30 years.
The forecast calls for the Phoenix MSA to continue to drive state growth during the next 30 years, although Tucson contributes as well. While growth slows, Phoenix and Tucson population growth rates are forecast to far outpace the U.S.
Risks to the Outlook
Risks to the short-run baseline forecast are elevated. The baseline forecast is assigned a 50% probability. The pessimistic alternative is assigned 45% with the optimistic scenario assigned the remaining 5%.
The U.S. pessimistic scenario assumes that the Russia-Ukraine conflict results in higher energy prices and lower global growth than the baseline. It also assumes that supply-chain issues continue for longer. This scenario includes a recession, with six consecutive quarters of negative real GDP growth (Exhibit 4). Even so, the pessimistic scenario does not include a downturn in real GDP as severe as the Great Recession, but it is projected to be similar in depth to the downturns in the early 1980s.
Exhibit 4: U.S. Real GDP Growth Under Alternative Scenarios, IHS Markit July 2022
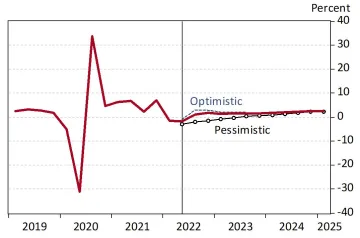
The pessimistic scenario results in a significant slowdown in state growth with modest job losses in early 2023.
Risks to the long-run forecast revolve around the labor force, productivity, investment in private and public physical capital, and natural resources.
During the next 30 years, Arizona’s population and labor force growth will increasingly depend on migration to the state. That elevates the importance of factors that potential migrants consider when moving across states, like the cost of living, as well as tax and regulatory policies.
Productivity is significantly influenced by the human capital present in states and regions. Educational attainment is one key element of human capital. During the past 30 years, states and metropolitan areas with higher concentrations of highly educated residents have generated stronger job, population, and income growth than areas with lower concentrations. Given existing trends toward automation, this pattern will likely continue and may even intensify. Keep in mind that the share of Arizona’s working-age population with a bachelor’s degree or more is well below the national average.
Continued private and public investment in physical capital will matter as well, including commercial and industrial facilities and machinery as well as highways, roads, water, and sewer infrastructure, air transportation infrastructure, border ports, and telecommunications (broadband, etc.).
Natural resource availability will also matter, particularly for water. With impending large cuts to the state’s Colorado River allocation, drought, and climate change, there is growing pressure to change current water use practices. Restricted water availability and/or rising water costs would raise the cost of living and doing business in the state, with possible negative impacts on growth.
VIEW MOST RECENT FORECAST DATA FOR ARIZONA, PHOENIX, AND TUCSON
If your business or organization requires more timely and in-depth forecast data and analysis, find out about the benefits of joining EBRC’s Forecasting Project and email EBRC director George Hammond at ghammond@arizona.edu.
Copyright 2022 Economic and Business Research Center, The University of Arizona, all rights reserved.