
Arizona’s Economy: Steady as She Goes
Second Quarter 2024 Forecast Update

2024 Breakfast With the Economists Slides in PDF
The Arizona economy kicked off the new year in solid shape. The labor market has normalized somewhat, with quit and hire rates back to pre-pandemic levels and steady job gains. Even so, the state unemployment rate is near historic lows. Phoenix inflation has moderated and is below the national rate. Real income growth has accelerated but retail plus remote sales have lost momentum. The housing market remains stressed, with rising home prices and elevated mortgage interest rates taking a toll on housing affordability.
The baseline outlook calls for the U.S. economy to avoid recession in the near term, which translates into continued solid, but slowing, gains in Arizona, Phoenix, and Tucson. As we look further out, the aging of the baby boom generation brings slowing growth across the major macroeconomic indicators. Even so, Arizona is projected to outpace the U.S. While recession risks remain an important consideration, a modest U.S. downturn would likely slow Arizona’s gains below the baseline forecast but not cause major job losses.
Arizona Recent Developments
The latest Current Employment Statistics program benchmark updates were released in March. State job growth was revised up for both 2022 and 2023. As Exhibit 1 shows, Arizona job growth was revised up from a preliminary estimate of 2.1% to 2.6%, or from slightly below the national rate (of 2.3%) to a bit above the U.S. Phoenix MSA job gains were revised up more significantly, from an initial estimate of 2.2% to 3.0%. Tucson MSA job growth was revised up from 1.4% to 1.6% and Prescott MSA job growth was revised up from 1.6% to 1.7%.
Exhibit 1: Arizona and U.S. Job Growth Rates, 2022-2023, Percent
The benchmarked Arizona unemployment rate for 2022 and 2023 was 3.8% and 3.9%, respectively, unchanged from the preliminary data. That was above the national rate in both years at 3.6%.
Phoenix MSA all-items CPIU inflation remained below the national average in April 2024, at 2.6% over the year. That was below the U.S. at 3.4%. It was slightly faster than the February rate of 2.2%. Both Phoenix and U.S. inflation rates were well below recent peaks in the summer of 2022 of 13.0% and 9.1%, respectively.
Slower growth in shelter inflation has contributed significantly to the deceleration both in Phoenix and nationally. The shelter CPIU includes rent, imputed owner-occupied rent, and short-term rentals. This is a major component of the all-items index. The Phoenix shelter CPIU rose 3.5% over the year in April while the national index rose faster, at 5.5%.
Overall services inflation, which includes housing services like shelter, has moderated, but remained relatively rapid. The Phoenix services CPIU rose 4.6% over the year while the national index rose 5.3%. In addition to housing services, the services index includes travel and tourism, health services, educational services, and many more intangible products.
Commodities inflation declined rapidly from a recent peak during the summer of 2022, in part thanks to normalizing global supply chains. The commodities index includes tangible goods, like gasoline, new and used cars, appliances, apparel, food, and other tangible goods. The Phoenix MSA commodities index declined 0.7% over the year in April, while the national index rose 0.3%.
Core inflation has also moderated significantly from two years ago. The all-items less food and energy index rose 3.0% over the year in Phoenix and 3.6% nationally. That was down from peaks in the summer/fall of 2022 of 12.3% in Phoenix and 6.6% nationally.
With the release of the fourth quarter 2023 personal income data, we now have the preliminary estimate for the full year. The current data show that Arizona personal income rose 6.5% in 2023, up from 4.9% in 2022. Income growth in 2022 was dragged down by the drop in federal income support related to the pandemic. Arizona personal income growth last year outpaced the national average in each major component.
The new data put Arizona’s per capita personal income at $61,652 in 2023, up 5.6% over 2022. That was faster than national growth at 4.7%. Arizona’s per capita personal income in 2023 was 90.0% of the U.S. average, at $68,531. Relative to other U.S. states (and the District of Columbia), Arizona ranked 34th in the nation in 2023.
Statewide housing activity ended 2022 and began 2023 very weakly (Exhibit 2). However, as 2023 progressed, permit activity increased strongly. That relative strength continued in the first quarter of 2024, with Arizona seasonally-adjusted total permits up 30.1% over the year. That was led by single-family permits which roughly doubled over the year. Similarly, housing permits started 2024 strong in Phoenix and Tucson, with single-family permits leading the way. Multi-family permits were down over the year in the first quarter of 2024 for Arizona, Phoenix, and Tucson.
Exhibit 2: Arizona Housing Permits, Seasonally-Adjusted Annual Rates
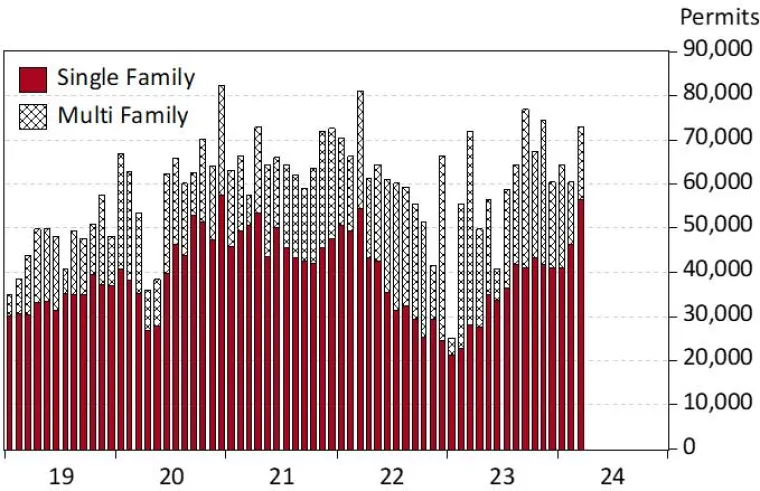
Arizona house prices continued to rise through the first quarter of 2024. The Phoenix median house price hit $444,990 in March 2024, up 6.0% over the year. The Phoenix Case-Shiller Index rose 4.9% over the year in February (latest data). The Tucson median house price increased 7.3% over the year in March to reach $364,900.
Arizona taxable retail sales (plus remote) rose at an anemic 1.5% over the year in the first quarter of 2024. Growth was even slower in the Phoenix MSA, at 0.9%, while Tucson fared better with a 3.1% increase. Driving growth during the period was the remote sellers component, which rose more than 10% over the year for the state and the two largest metropolitan areas. By 2023, this component accounted for just over 10% of total retail plus remote sales in all three geographies.
Taxable sales at restaurants and bars has also slowed significantly, although gains were faster than in the retail plus remote category. Statewide taxable sales at restaurants and bars was up 2.7% over the year in the first quarter, up 2.4% in Phoenix, and up 3.8% in Tucson.
Arizona Outlook
The baseline outlook for Arizona calls for continued but gradually slowing growth (Exhibit 3). The source of decelerating growth is the ongoing demographic transition driven by the aging of the baby boom generation.
The state labor market gradually loosens as job gains slow from 2.6% in 2023 to 2.2% in 2024 and 2.0% in 2025. Even though growth slows, Arizona is forecast to add jobs significantly faster than the nation. With slower job gains, the unemployment rate is forecast to rise from 3.9% in 2023 to 4.3% in 2025.
Exhibit 3: Arizona Outlook Summary, Annual Growth Rates and Levels
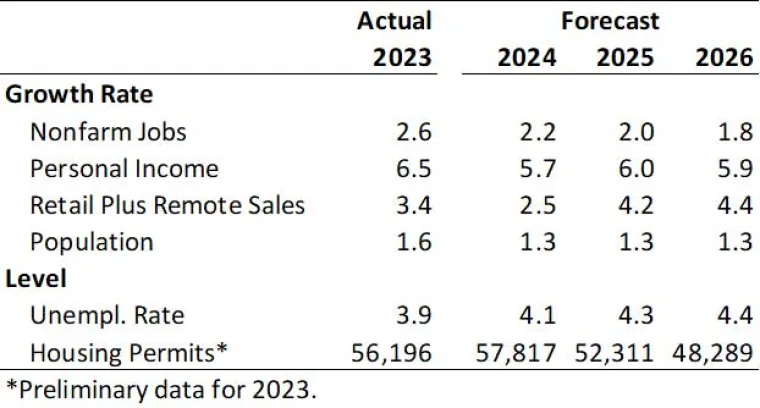
State population growth also declines, from 1.6% in 2023 to 1.3% in 2024 and 2025, driven by a slower pace of net migration. This, in turn, results from lower mobility within the U.S. as relatively high interest rates and reduced housing affordability weigh on preferences for migration.
Personal income growth slows in 2024 to 5.7%, after strong growth in 2023 of 6.5%. Growth rebounds modestly in 2025 to 6.0%. The pace of retail sales (plus remote retailers) also decelerates in 2024, falling from 3.4% last year to 2.5% in 2024. Sales growth recovers in 2025 to 4.2%.
Housing permit activity rises in 2024, after declining last year, reflecting increased permit activity for single-family homes. Starting in 2025, permits gradually drop to a level more consistent with population growth.
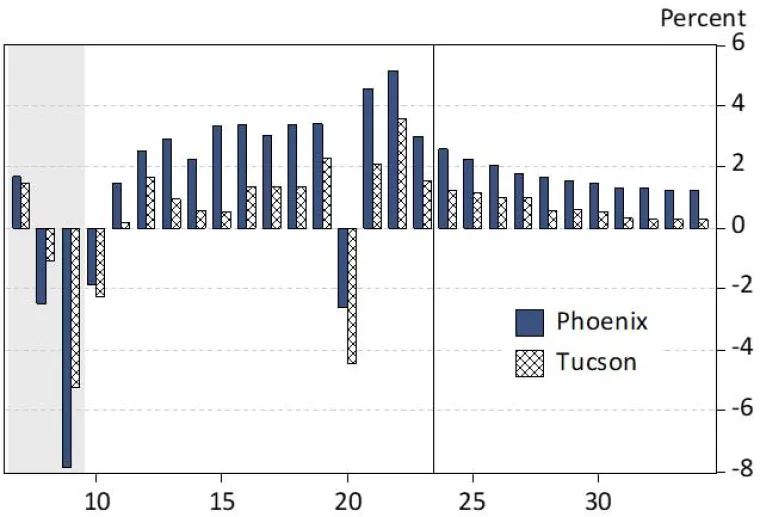
The Phoenix MSA drives growth for the state, but even there gains slow during the forecast (Exhibit 4). Job growth drops from 3.0% in 2023, to 2.6% in 2024, and again to 2.2% in 2025. Population growth slows from 1.8% last year to 1.5% in 2024 and 2025.
The Tucson MSA experiences a similar slowdown, with job growth dropping from 1.6% in 2023 to 1.2% in 2024 and 2025. Population growth decelerated significantly last year (to 0.7%) and slows a bit more in 2024 and 2025, to 0.6%.
Exhibit 4: Phoenix and Tucson Job Growth, Annual, Percent
VIEW MOST RECENT FORECAST DATA FOR ARIZONA, PHOENIX, AND TUCSON
If your business or organization requires more timely and in-depth forecast data and analysis, find out about the benefits of joining EBRC’s Forecasting Project and email EBRC director George Hammond at ghammond@arizona.edu.
Copyright 2024 Economic and Business Research Center, The University of Arizona, all rights reserved.