Arizona’s Economy Hits the Pause Button
Fourth Quarter 2021 Forecast Update

Arizona’s job recovery hit the pause button in the third quarter, as the pandemic gained momentum again. Although state job growth slowed during August and September, according to preliminary estimates, employment is close to its pre-pandemic high. That is just the first milestone in the state’s labor market recovery. The unemployment rate remains above the national average and above its level before the pandemic began. House prices continued to surge in the third quarter, reflecting strong demand as well as supply disruptions. Housing permit activity remained strong.
Assuming that the vaccines remain effective against COVID-19, the forecast calls for Arizona job and population growth to gain momentum in the near term. In contrast, income growth and retails sales soften as federal income support dissipates and households draw down savings. Downside risks outweigh upside risks at this time, as the course of the pandemic continues to generate surprises and as supply-chain disruptions remain a concern
Arizona Recent Developments
Arizona job growth slowed recently, mirroring the deceleration nationally. The slowdown was at least partially connected to the resurgence of the pandemic during the fall. It may also reflect the broader labor market disruptions brought on by the pandemic that have caused workers to reevaluate their current employment situation. These factors include reduced child-care options, the lure of retirement, and shifts in desired industries and occupations.
As of October, Arizona nonfarm payroll jobs were just 6,100 below their February 2020 peak, according to the preliminary estimates. Normal gains in November would put the state back on par.
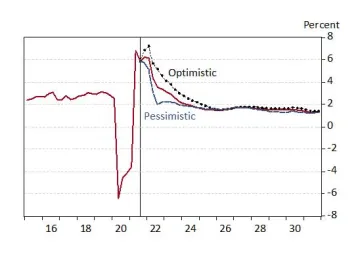
Arizona has replaced 98.2% of the jobs lost in the initial months of the pandemic (Exhibit 1). Most metropolitan areas in the state posted employment levels above February 2020. The two exceptions were Flagstaff and Tucson, which had job replacement rates of 84.9% and 77.5%, respectively.
Exhibit 1: Share of Jobs Lost During the Pandemic That Have Been Replaced as of October 2021
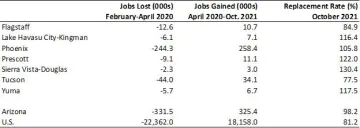
Exhibit 2 shows the change in seasonally-adjusted jobs by industry from February 2020 to October 2021. Government jobs were 19,600 below pre-pandemic levels, with most of the gap in local government. Leisure and hospitality jobs were 18,100 below February 2020, with the biggest gap in accommodation and food services. Information jobs were 5,500 below their prior peak and other services jobs were 2,500 jobs below February 2020.
Trade, transportation, and utilities jobs were 36,800 above February 2020 in October. Transportation and warehousing jobs were up 25,600 and retail trade jobs were up 9,400. Professional and business services; education and health services; manufacturing; financial activities were modestly above their pre-pandemic peak. Natural resources and mining jobs were equal to their February 2020 level in October.
Exhibit 2: Arizona Jobs by Industry, Change From February 2020 to October 2021, Seasonally Adjusted, Thousands
The state’s seasonally-adjusted unemployment rate fell to 5.2% in October, down from 5.7% in September. That was above the national rate of 4.6% and above its February 2020 rate of 4.9%. In addition, the Arizona employment-population ratio and labor force participation rate remained well below pre-pandemic levels. The state’s labor market has not yet recovered to pre-pandemic performance.
Arizona personal income declined by 26.5% in the second quarter, faster than the national drop of 21.8%. Arizona’s growth ranked 34th in the nation and followed a 61.8% increase in the first quarter of the year.
The state personal income decline in the second quarter was driven by reduced transfer receipts, which fell by $35.5 billion. The drop reflected reduced federal income support from economic impact payments and unemployment insurance benefits related to the pandemic. Transfer receipts fell in every state.
In contrast, Arizona net earnings from work rose rapidly in the second quarter, up by 8.4%. Even so, that was below the national average gain of 10.7%. This reflected the strong job recovery during the spring.
With this release, state quarterly personal income has been revised back to 1998. The latest estimates show that Arizona personal income rose by 10.3% in 2020, up from 5.8% in 2019. Disposable income increased by 11.3% in 2020, up from 5.7% in 2019. Per capita personal income rose by 8.4% in 2020, up from 3.9% in 2019. The Bureau of Economic Analysis relied on population estimates based on the 2010 Census.
While construction job growth has been soft since the pandemic began, house prices and housing permits have surged upward. The Phoenix MSA median home price rose to $440,000 in October 2021, up 25.7% over the year. The Tucson MSA home price increased to $325,000, up 20.4% over the year. The Case-Shiller house price index for Phoenix rose 33.1% in September.
The rapid rise in house prices this year is related to factors impacting both the supply and demand-side of the market. On the demand side, it is likely that household formation rates have risen due to increased migration into the state (remote workers relocating from high-cost metropolitan areas to lower-cost states). It is also possible that household formation has increased with roommates separating into individual households, increased divorce rates, and other pandemic-related factors. There are not yet data on these other factors but they may be in the mix. Supply-side issues include rapidly rising construction input costs, labor shortages, and low housing inventories.
At the same time house prices have skyrocketed, so have housing permits. Statewide total permits (seasonally adjusted) were up 13.5% over the year through October. Most of that growth was driven by single-family permits (up 17.2%). Multi-family permits were up 4.1%.
Total housing permits in the Phoenix MSA were up 11.9% over the year through October, with single-family permits up 17.7% and multi-family permits up 0.5%.
Growth in total permits was even strong in Tucson, with an increase of 30.0%. Single-family permits were up 31.2% and multi-family permits were up 22.2%.
Arizona Outlook
The outlook for Arizona, Phoenix, and Tucson depends in part on national economic performance. The forecasts presented here are based on U.S. projections produced by IHS Markit in October 2021.
The baseline forecast (summarized here) is assigned a 50% probability. The pessimistic scenario is assigned 30% and the optimistic scenario is assigned the remaining 20%.
The baseline forecast calls for U.S. real GDP to rise by 5.4% in 2021, 4.3% in 2022 and then decelerate to 2.8% and 2.7% in 2023 and 2024, respectively.
Nonfarm payroll jobs nationally dropped by 5.7% in 2020, but rebound in 2021 with growth of 2.6% in 2021 and 3.6% in 2022.
The unemployment rate peaked at 8.1% for the year in 2020. It is forecast to decline to 5.5% in 2021 and 4.1% in 2022.
Inflation gathers momentum during the near term, with an average price increase of 4.3% in 2021 followed by a rapid deceleration to 3.0% in 2022, and 2.1% in 2023. Inflation moderates as supply-chain issues ease and workers return to the labor force.
Housing starts surged in 2020 to 1.40 million units. Activity rises to 1.58 million in 2021, before softening to 1.33 million by 2024.
This sets the stage for Arizona’s jobs recovery to continue. After losing 93,200 jobs in 2020 the state is forecast to add 105,700 jobs in 2021 and 127,200 in 2022. As Exhibit 3 shows, that translates into growth of 3.7% in 2021 and 4.3% in 2022.
Population gains accelerate through 2022, as Arizona attracts remote workers from high-cost western metropolitan areas, before gradually decelerating as demographic pressures come to the fore.
Faster population gains in the near term contribute to strong housing permit performance. As population gains moderate, so does housing permit activity.
The huge amount of federal income support that drove income gains in 2020 and 2021 dissipates in 2022. That generates slower gains in retail sales (particularly for goods).
Exhibit 3: Arizona Outlook Summary
The Phoenix MSA continues to drive state growth during the forecast, with rapid job, population, income, and sales gains. The Tucson MSA contributes to growth but at a slower pace.
Risks to the Outlook
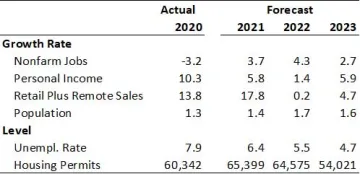
The baseline outlook calls for Arizona to generate strong job and population growth in the near term as income and sales growth decelerate. Exhibit 4 shows the state job growth forecasts for the baseline, pessimistic, and optimistic scenarios. The baseline outlook is assigned a 50% probability.
The pessimistic scenario is assigned a 30% probability. It assumes a resurgence of the pandemic in the winter months, with rising hospitalizations and deaths. This prevents a rapid recovery in travel and tourism. It also assumes that supply-chain issues drag on into next year. This slows growth in consumer spending on durables. Together, these factors provide a significant drag on U.S. and Arizona growth.
The optimistic scenario (20% probability) assumes that travel and tourism recovers rapidly, supply-chain issues are resolved more quickly, and that consumers respond more positively to infrastructure spending. These factors generate stronger near-term growth.
Exhibit 4: Three Scenarios for Arizona Job Growth, Over-the-Year Growth Rate