Arizona Economic Outlook
Third Quarter 2025
Arizona Economic Forecast
September 5, 2025
The forecast numbers below are from our third quarter 2025 baseline scenario forecast and were produced in August 2025 by the EBRC.
Arizona’s Economy Navigates High Seas
By George W. Hammond, Ph.D., Director and Research Professor, EBRC
Arizona’s economy lost steam last year, with very slow job gains. That weakness has continued into 2025, according to the preliminary data. This has been matched by modestly rising unemployment and rapidly falling hire rates. Overall, the labor market appears to be on a knife-edge, if the preliminary data are correct. Income growth was also slow to start the year, but taxable retail sales growth has firmed through June. Housing cost burdens remain very high, with housing permit activity down so far this year, compared to the same period last year.
If the U.S. economy avoids recession in the near term, as assumed in the baseline forecast, the outlook calls for Arizona to post another year of slow gains in 2025, before modestly accelerating in 2026 and 2027. Near-term recession risks remain elevated, driven by heightened economic uncertainty originating from the unpredictable policy process pursued by the current federal administration.
The baseline long-term forecast calls for growth in Arizona to slow significantly during the next 30 years, compared to the prior 30 years. Even so, gains in the state are expected to far outpace national growth. This slowing is driven in large part by demographic forces, namely the aging of the baby boom generation. This demographic transition will eventually cause Arizona’s population growth to be completely dependent on net migration. That will not only slow population gains, but it will make population change much more volatile.
Arizona Recent Developments
Arizona added 34,300 jobs over the year in July, which translated into 1.1% growth. That outpaced the U.S. at 0.9%. Job gains were very unbalanced, with private education and health services dominating gains. Four sectors were down over the year: manufacturing; government; trade, transportation, and utilities; and information.
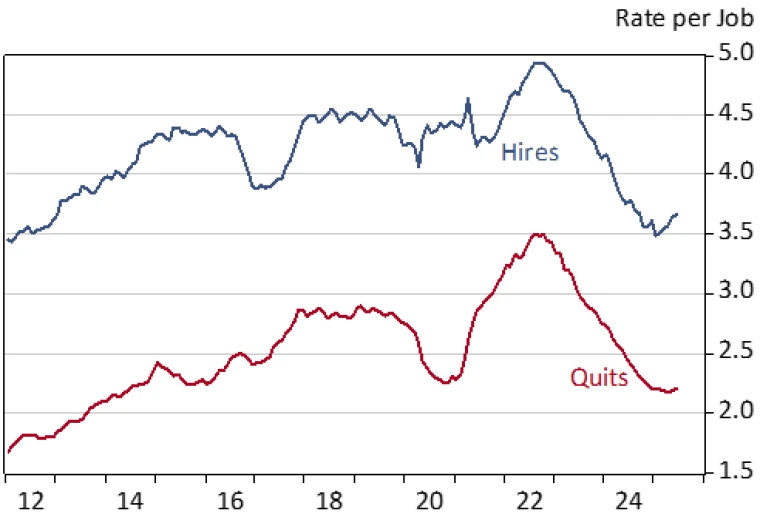
Arizona’s job growth in 2024 and so far in 2025 has been unusually slow. That was partly driven by an increase in unemployment, with the seasonally-adjusted rate rising from 3.3% in March 2024 to 4.1% currently. Another important factor recently has been a steep drop in the hires rate (Exhibit 1). The state hires rate has declined from 5.2% in July 2022 to 3.6% in June 2025. At the same time, the quits rate has fallen from 4.7% in March 2022 to 2.3% in June.
Exhibit 1: Arizona Hire and Quit Rates, Seasonally Adjusted, Twelve-Month Moving Average

Arizona housing permits started 2025 slow. Statewide, seasonally-adjusted permits were down 8.8%, compared to the same period in 2024. Single-family permits were down 1.6% while multi-family permits were down 24.6%.
House price growth has slowed significantly in Phoenix and Tucson, after the huge surge in 2021 and 2022 (Exhibit 2). In Phoenix, the median house price was flat over the year in July at $440,000. The median-priced house in Tucson was $365,000 in July, which was also unchanged over the year. The Case-Shiller Index for the Phoenix MSA was up just 0.9% over the year in May (latest data).
Exhibit 2: Phoenix and Tucson Median House Price and Phoenix Case-Shiller Index, Seasonally Adjusted

Even with significantly slower house price growth, housing affordability remains compromised. According to data from the Federal Reserve Bank of Atlanta, the cost of a median-priced home in Phoenix required 47.2% of median household income in May 2025. In Tucson, the ratio was 45.0%. Both of the state’s largest metropolitan areas were near the national average of 47.7%. In contrast, the ratio in the Prescott MSA was much higher, at 68.1%.
Those rates were far higher than in 2019. In that year, the Phoenix ratio was 27.7%, the Tucson ratio was 28.5%, and the Prescott ratio was 38.5%. Nationally, the ratio was 29.0%. The rule-of-thumb is that a ratio above 30% indicates that households are housing cost burdened.
Arizona taxable sales growth for retail plus remote sellers was solid in the first half of the year, up 4.7% over the same period in 2024. That was stronger than gains during the same period of 2024. Phoenix sales were up 4.9% over the year and Tucson sales were up 2.8%. Sales in the Prescott MSA increased 3.9%.
In contrast, restaurant and bar sales remained sluggish in the first half of 2025, up only 2.5% statewide. Sales were up 2.7% in Phoenix, 0.4% in Tucson, and 2.0% in Prescott.
Arizona Long-Run Outlook
The long-term outlook for Arizona, Phoenix, and Tucson calls for continued growth that outpaces the U.S. but falls far short of rates during the prior thirty years (Exhibit 3). Arizona is projected to add 2.6 million residents during the 2025-2055 period. That translates into an average annual growth rate of 1.0% per year, which far outpaces the U.S. at 0.2% per year. Even so, Arizona’s population growth rate is expected to fall far short of its 2.0% per year pace during the 1994-2024 period.
Exhibit 3: Job and Population Annual Growth Rates, History and Forecast

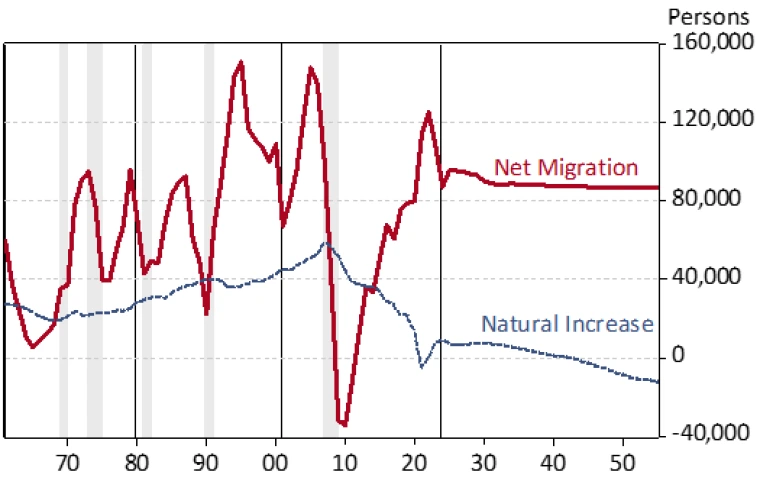
One reason for the state’s slowing population growth is declining natural increase (annual difference between births and deaths). As Exhibit 4 shows, the state’s natural increase is expected to turn to natural decrease (more deaths than births each year) in the mid-2040s. The driving demographic trends causing this are the aging of the baby boom generation and birth rates that have fallen significantly since 2007.
This trend in natural increase means that, eventually, net migration will be not just the main source of population growth for the state, it will be the only source.
Exhibit 4: Arizona Natural Increase (Births Minus Deaths) and Net Migration

Risks to the Outlook
The short-run baseline forecast calls for the U.S. economy to avoid recession. That translates into continued growth for Arizona, Phoenix, and Tucson. The pessimistic scenario (25% probability) calls for a moderate U.S. recession during the second half of 2025. This generates slower growth in 2025 and modest job losses statewide in 2026 (compared to the baseline). The optimistic scenario (25% probability) envisions stronger U.S. growth, which produces stronger gains in Arizona, again compared to the baseline.
In the long term, risks revolve around the factors that drive long-term growth: demographics (including human capital), private physical capital investment (buildings, machinery), public capital investment (highways, roads, water, sewer, ports), and resource availability (water).
Arizona’s population is changing demographically as the baby boom generation ages. This is putting downward pressure on natural increase (births minus deaths), which is one key source of population gains. If natural increase continues to fall (as the baseline forecast suggests) it will turn into natural decrease in the mid-2040s. At that point, net migration will be the only source of population growth. If natural increase declines faster than expected, or net migration turns out to be slower than expected, then Arizona’s population growth will fall below forecast. This, in turn, means slower labor force and job growth.
Further, the current federal administration’s pursuit of mass deportations and restricted immigration will also contribute to slower population and labor force growth. The more strictly these policies are pursued, the greater the risk to potential growth in the economy.
Human capital (the health and educational attainment of the state’s population) also matters for growth. Educational attainment, particularly the share of the population with a bachelor’s degree or better, is a key driver of state and local innovation and productivity growth, requires significant investment at the state and local level.
Innovation is the main source of improvement in our overall standard of living. AI/automation will be one major way that households and firms experience economic innovation in coming years. AI will help drive improvements in our average standard of living, in the face of a demographically driven deceleration in labor force growth. It will also disrupt the labor market, eliminating some industries/occupations and creating others. It is far from clear at this point what the net impact will be on job growth and economic inequality, but the risks are certainly there.
Private physical capital investment will also be a key driver of long-run growth. Maintaining a competitive tax and regulatory climate will be crucial for attracting those investments. Private physical capital investment is not enough on its own, it must be paired with public capital investments in highways, roads, water, sewer, telecommunications, and border port infrastructure.
Tariffs impact the tax and regulatory environment in which firms and consumers operate. It has long been proved by economists that tariffs are a very distortionary way for the federal government to raise revenue. Tariffs greatly benefit a few firms and workers at the expense of smaller, permanent (as long as the tariff is imposed) decreases in the standard of living of the remaining population. The net result is a smaller, less efficient, and ultimately poorer economy.
Finally, water is a key resource and a key concern at the moment. How water is allocated (who gets to use that resource) and the price at which it is available will be a key concern in Arizona’s future. The long-term forecasts summarized here assume that water is not a constraint on job and population growth. That is an assumption that should be kept in mind.
VIEW MOST RECENT FORECAST DATA FOR ARIZONA, PHOENIX, AND TUCSON
If your business or organization requires more timely and in-depth forecast data and analysis, find out about the benefits of joining EBRC’s Forecasting Project and email EBRC director George Hammond at ghammond@arizona.edu.
Copyright 2025 Economic and Business Research Center, The University of Arizona, all rights reserved.
The forecast numbers below were released by EBRC on September 5, 2025
Third Quarter 2025 Baseline Scenario Economic Forecast
Copyright 2025 Economic and Business Research Center, The University of Arizona, all rights reserved.

