Making Action Possible Dashboard

MAP's mission is to measurably improve southern Arizona through data-driven, collective civic action and education. Find a wide range of socio-economic indicators exploring key trends, and make relevant comparisons across counties, western metros and states, and the nation.
Signature Graphics Benchmark Progress
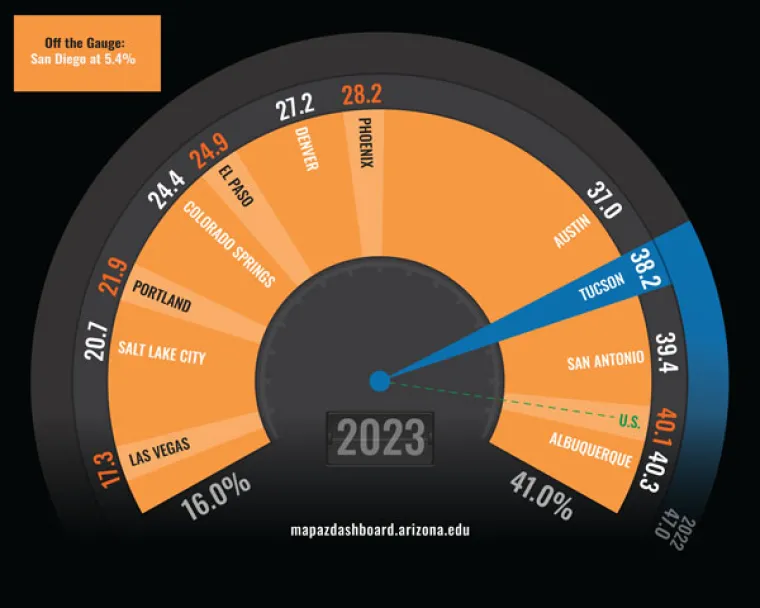
MAP's signature fuel gauge graphics compare important indicators to the U.S., 12 peer western metro areas and 10 western states. For example the gauge below rates housing affordability across peer western metros.
Housing Affordability (2023)

Track 36 Indicators Across 6 Categories
MAP Indicators
- Economy
- Business Growth
- Employment Growth by Industry
- GDP by Industry
- Housing Affordability
- Median Household Income
- Patents
- Education
- College Major
- Educational Attainment
- High School Graduation Rates
- PreK-12 Enrollment
- Student Achievement
- Teacher Wages
- Health and Social Well-Being
- Behavioral Health
- Health Insurance Coverage
- Housing Cost Burden
- Physical Well-Being
- Poverty Rate
- Teen Birth Rate
- Infrastructure
- Air Travel
- Bicycling Capacity
- Energy Use
- Internet Access
- Residential Water Use
- Transportation to Work
- Quality of Place
- Air Quality
- Cost of Living
- Creative Occupations
- Outdoor Recreation Opportunities
- Public Safety
- Voter Turn-Out
- Workforce and Demographics
- Employment Share by Industry
- Labor Force Participation Rate
- Occupational Wages
- Population Profile
- Wage Distribution
- Working Age College Graduates
MAP Scorecards
Each category page includes an easy-to-understand scorecard summarizing current performance for six key indicators. For example, here's Tucson's Education scorecard:
Tucson Metropolitan Statistical Area Education Scorecard

Follow MAP on Twitter
Follow MAP on Twitter @MapAZDashboard

